
Frequently Asked Questions
What is SmartSkor?

SmartSkor is a research-driven score published once each trading day for every stock on BIST. It distills dozens of signals from the academic finance literature into a single number from 1 to 10 that summarizes a stock's expected one-month-forward return. A high score means the stock looks more attractive along the dimensions our model measures.
How can I get access to the most recent SmartSkors?
The most recent SmartSkors are available to subscribers. Scores are recalculated once each trading day — the data flow runs after BIST closes and the updated scores are live by the following morning — so subscribing means you always see the freshest rankings. You can become a subscriber directly on our website.
How can I cancel my subscription?
Send a short email to support@smartskor.com and our team will handle the cancellation for you. Including the email address you signed up with helps us locate your account quickly.
Can I try SmartSkor for free?
Yes. We offer a two-week free trial so you can explore the daily SmartSkors and see how they fit into your own investment process before deciding whether to subscribe.
How can I contact SmartSkor support?
Email us at support@smartskor.com — it's the fastest way to reach the team. Whether your question is about your account, billing, or the scores themselves, include a brief description and we'll get back to you as soon as we can.
What factors make up the score?
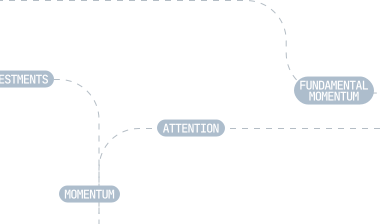
The score combines dozens of characteristics organized under six categories: Profitability, Value, Investment Discipline, Momentum, Fundamental Momentum, and Healthy Attention. Every characteristic carries equal weight — we don't do data mining. For the detailed breakdown, see the methodology page.
How often is it updated?
Once each trading day. The data flow runs after BIST closes; by the following morning, the previous day's SmartSkor is live in the app. Some inputs change with daily market data, others as companies publish their quarterly financials.
Is a high SmartSkor a buy signal?
No. SmartSkor is a numerical ranking, not investment advice. A score of 9 means the stock is attractive along the dimensions our model measures; it carries no view about your portfolio, your risk tolerance, or your investment horizon. Treat it as an input alongside your own analysis.
Why don't you compute a stock's intrinsic value?
Intrinsic-value models require too many subjective inputs — growth rates, margins, discount rates — and small differences change the result dramatically. Instead, we measure each stock by comparing it to the rest of the BIST universe: by profitability, valuation relative to fundamentals, momentum, and balance-sheet strength. That approach depends far less on forecasting and far more on observable data.
What is a model portfolio?
A rules-based portfolio generated automatically from the SmartSkor universe. Each strategy applies a specific selection rule — top 10 by score, top picks within BIST 30, dividend leaders, and so on — and is rebalanced on the first trading day of each month. We publish both the holdings and the historical performance.
How many model portfolios are there?
13 active portfolios in five families: broad-based (SmartSkor Top 10 and Top 20), index-based (BIST 30, BIST 100, and Non-BIST 100 Top Picks), sector-based (Top Financials, Top Industrials, Top Services), theme-based (Top Sustainability, Top Dividends, Top Participation), and geography-based (Top Istanbul, Top Anatolia). Each holds the highest-SmartSkor stocks in its universe, equal-weighted.
What does SmartFonSkor cover?
Equity-weighted investment funds traded on TEFAS. Each fund's score is the weighted average of the SmartSkors of its month-end holdings — it measures the aggregate quality of the fund's current portfolio and updates monthly as funds disclose holdings via KAP.
What is SmartSectorSkor?
SmartSkor extended to the sector level: the SmartSkor of every stock in a sector, weighted by market capitalization and averaged. We track 25 sectors, recalculated daily. The sector score points you toward a starting place; stock selection should still rest on the individual SmartSkor.
Where does the data come from?
End-of-day stock data and index membership come from KAP — the Public Disclosure Platform of Türkiye; fund holdings and price data come from TEFAS. Our daily flow ingests these sources after BIST close, runs the SmartSkor calculation, and updates the model portfolios.
Are the published returns net of costs?
Returns include dividends (total return, benchmarked against total-return indices) but are gross of commissions, fees, and slippage. Historical performance is a backtest, not a guarantee — a real investor following the same strategy will generally see a lower net return than the simulated line.
Are your scores investment advice?
No. All of TuneUp's scores and model portfolios are numerical rankings and research-driven projections; they are not investment advice. They carry no view about your portfolio, your risk tolerance, or your investment horizon. Treat them as inputs alongside your own analysis.
Turn insights into profitable investment decisions with SmartSkor
Move beyond historical rankings, invest based on the forward-looking
quality of publicly traded equities.

value
attention
momentum
fundamental
momentum
momentum
investments
profitability